
Steps towards a Sustainable Future

Written by Lucy Edwards
Lucy is an Architect at BoonBrown with a passion for sustainable, context driven design that responds sensitively to the needs of both users and the environment. As a member of BoonBrown’s Social Value Committee, Lucy is championing carbon footprint awareness and environmental initiatives within the office.
![]()
![]()
As part of BoonBrown’s Social Value Strategy, over the last two years we have been calculating and tracking the Carbon Footprint of our Southwest and London Studios.
As a practice, we are committed to reducing our carbon footprint to achieve Net Zero by 2040. This aligns with the government’s goal to achieve Net Zero emissions in the UK by 2050. The first step in reducing our carbon footprint is to measure our existing impact so that we can identify areas of improvement to reduce our carbon emissions where possible. For emissions which cannot practicably be reduced, we will look at offsetting measures to reach our target goal of Net Zero.
This initial exercise of measuring our existing carbon footprint has highlighted some interesting findings and statistics, helping to raise awareness of our environmental impact, both collectively as a business and individually through our own day-to-day habits. We are now well placed to identify steps we can take to actively reduce our emissions and have a better understanding of the remaining emissions which will require offsetting.
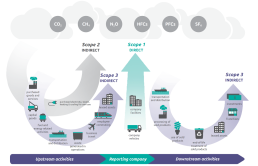
Scope 1, 2 & 3 Emissions
There are three ‘Scopes’ which make up our Carbon Footprint calculations, as defined by the Greenhouse Gas Protocol (GHG Protocol) established in 1998:
- Scope 1 covers all direct emissions from sources controlled by an organisation, such as burning fuel in company vehicles, refrigerants, and burning gas in boilers.
- Scope 2 includes indirect greenhouse gas emissions from purchased energy, such as electricity, heating, cooling, and steam.
- Scope 3 covers all remaining indirect greenhouse gas emissions from activities, from sources not owned or controlled by an organisation.
Scope 1 and 2 emissions are generally easy to quantify and record. However, Scope 3 emissions are much harder to measure despite typically accounting for 65% – 95% of an organisation’s total Carbon Footprint. Measuring Scope 3 emissions requires extensive assessment of the supply chain, including both upstream and downstream activities, and often relies heavily on estimates and third-party data.
BoonBrown Carbon Footprint
Our Carbon Footprint is calculated in tonnes of CO2e, or Carbon Dioxide Equivalent. This is a metric measure used to compare emissions of different greenhouse gases based on their global warming potential. For example, emitting 1kg of methane has the same global warming potential as emitting 28kg of carbon dioxide, and is therefore equal to 28kg of CO2e.
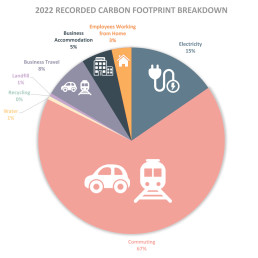
At BoonBrown, our Scope 3 emissions account for approximately 85% of our total Carbon Footprint and are broken down into the following categories:
- Employee Commuting
Calculated based on miles travelled, by transport and fuel type.
- Business Travel
Calculated in the same way as Employee Commuting.
- Business Accommodation
Based on number of nights spent in hotel accommodation.
- Waste and Recycling
Calculated based on total weight of items recycled or sent to landfill, which is recorded as part of our ISO14001 processes.
- Water Usage
Calculated using total water consumption in m3.
- Employees Working from Home
Based on average number of days per week spent working from home.
We used the Small Business Carbon Calculator created by Climate Impact Partners to convert our collected data into tonnes of CO2e.
Our total Carbon Footprint for 2022 was calculated at 80.11 tonnes CO2e, equal to approximately 20 elephants! A full breakdown of our calculations and the emissions attributable to each of the above categories is available in our Carbon Reduction Plan on our website here.
What have we learnt?
This exercise has been an enlightening process and allowed us to learn more about the theory behind carbon footprint calculation and better understand the environmental impact of our practices and individual actions. Sharing the findings with our teams in London and Yeovil has given weight to the environmental procedures we implement as part of our ISO14001 accreditation, encouraging staff to adopt new ways of working to reduce our carbon footprint.
As expected, our Scope 3 emissions account for most of our carbon footprint. However, we were surprised to learn that emissions from employee commuting make up such a large portion of this. This is partly down to several members of the southwest team commuting substantial distances to the office every day – journeys that would be difficult to undertake on public transport or by bike! This is an obvious area where we could make an improvement, and we intend to further explore options for reducing this impact next year.
Likewise, there are areas for improvement in our carbon footprint calculations. Since 2022 is the first full calendar year in our new London studio, much of the data for London has been calculated based on averages in the southwest office. Over 2023, we have increased our data collection in both studios which should improve the accuracy of our calculations. We also plan to include emissions from our purchased goods and services to give a fuller picture of our total carbon footprint.
Carbon Reduction Initiatives
Our Carbon Reduction Plan outlines both our implemented and proposed carbon reduction initiatives in detail. Below are some examples of initiatives at an individual level that all employees are implementing in their day-to-day working practices:
- Encouraged staff to switch to ‘green’ search engines, such as Ecosia, which uses profits from advertising to plant trees across the globe.
- Removed individual desk bins, to encourage proper recycling of waste.
- Turning off equipment when not in use, including lights, printers, PCs overnight and monitors when not at your desk.
- Only printing when necessary.
- Encouraged car sharing when commuting or attending remote meetings.
- Unplugging electrical items when fully charged and switching to reusable batteries where possible.
As a practice working in the construction industry, we are well placed to make positive ‘greener’ choices when designing and delivering our projects, encouraging and assisting clients to incorporate sustainable technologies and reducing the carbon impact of development where possible. As we develop our Net Zero strategy, we plan to actively seek opportunities for further offsetting solutions such as tree planting and habitat creation.
As the first full calendar year in our new London studio, 2022 will form our baseline Carbon Footprint calculation for both BoonBrown offices and we aim to see reductions in our collective Carbon Footprint year-on-year. When looking at the Yeovil studio alone, we have seen an estimated 12% reduction in our Carbon Footprint from 2019 to 2022 and we hope to see this positive trend continue over the coming years.