
Continuing our Journey to Net Zero
As part of BoonBrown’s Social Value Strategy, over the last five years we have been calculating and tracking the Carbon Footprint of our Southwest and London Studios. In 2023, we launched our inaugural Carbon Reduction Plan which outlined our baseline Carbon Footprint along with the carbon reduction initiatives we have implemented and proposed. Since the publication of this plan, we have continued to assess our carbon impact and have recently released an updated Carbon Reduction Plan, now available for viewing on our website here.
BoonBrown’s Carbon Footprint in 2025
As a practice, we are committed to reducing our carbon footprint to achieve Net Zero by 2040. This aligns with the government’s goal to achieve Net Zero emissions in the UK by 2050. The first step in reducing our carbon footprint was to measure our existing impact so that we could identify areas of improvement to reduce our carbon emissions where possible. For emissions which cannot practicably be reduced, we will look at offsetting measures to reach our target goal of Net Zero.
2025 Analysis
We have seen a marked decrease in our carbon footprint in 2025 compared to both 2024 and our baseline year in 2022. Our Scope 2 emissions have increased slightly from 12.50 tonnes CO2e in 2024 to 13.23 tonnes CO2e in 2025. However, there has been a reduction in Scope 3 emissions from 66.76 to 61.83 tonnes CO2e.
When considering BoonBrown’s carbon footprint per employee, we have continued to see a reduction from 1.82 tonnes CO2e in 2022, to 1.50 tonnes CO2e per employee in 2024. This is a reduction of approximately 17.5% since we began recording our Carbon Footprint in 2022.

Measuring our carbon footprint continues to highlight some interesting findings and statistics, helping to raise awareness of our environmental impact, both collectively as a business and individually through our own day-to-day habits. It also gives weight to the environmental procedures we implement as part of our ISO14001 accreditation.
Read on for a reminder of how we calculate our Carbon Footprint.
Scope 1, 2 & 3 Emissions
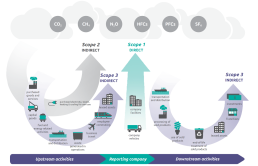
There are three ‘Scopes’ which make up our Carbon Footprint calculations, as defined by the Greenhouse Gas Protocol (GHG Protocol) established in 1998:
- Scope 1 covers all direct emissions from sources controlled by an organisation, such as burning fuel in company vehicles, refrigerants, and burning gas in boilers.
- Scope 2 includes indirect greenhouse gas emissions from purchased energy, such as electricity, heating, cooling, and steam.
- Scope 3 covers all remaining indirect greenhouse gas emissions from activities, from sources not owned or controlled by an organisation.
Scope 1 and 2 emissions are generally easy to quantify and record. However, Scope 3 emissions are much harder to measure despite typically accounting for 65% – 95% of an organisation’s total Carbon Footprint. Measuring Scope 3 emissions requires extensive assessment of the supply chain, including both upstream and downstream activities, and often relies heavily on estimates and third-party data.
BoonBrown Carbon Footprint
Our Carbon Footprint is calculated in tonnes of CO2e, or Carbon Dioxide Equivalent. This is a metric measure used to compare emissions of different greenhouse gases based on their global warming potential.
At BoonBrown, our Scope 3 emissions account for approximately 82% of our total Carbon Footprint and are broken down into the following categories:
- Employee Commuting
Calculated based on miles travelled, by transport and fuel type.
- Business Travel
Calculated in the same way as Employee Commuting.
- Business Accommodation
Based on number of nights spent in hotel accommodation.
- Waste and Recycling
Calculated based on total weight of items recycled or sent to landfill, which is recorded as part of our ISO14001 processes.
- Water Usage
Calculated using total water consumption in m3.
- Employees Working from Home
Based on average number of days per week spent working from home.
We used the Small Business Carbon Calculator created by Climate Impact Partners to convert our collected data into tonnes of CO2e.
Our total Carbon Footprint for 2022 was calculated at 80.11 tonnes CO2e, equal to approximately 20 elephants! In 2023 this increased slightly to 83.58 tonnes CO2e which can be attributed to additional recruitment and a return to normal working practices after Covid. 2025 saw a marked reduction to 75.07 tonnes CO2e. When calculated as an average per employee, we saw a reduction of 17.5% compared to our baseline 2022 figure. A full breakdown of our calculations and the emissions attributable to each of the above categories is available in our Carbon Reduction Plan on our website here.
Contact
